In examining financial information about the markets of the past, it’s difficult to find clear, consistent data that shows who was dominating the market and how, over time. While the Securities and Exchange Commission has been around to examine and prevent market issues since 1934†, the priority of recording data consistenly has only been a focus of governmental frameworks in recent years.
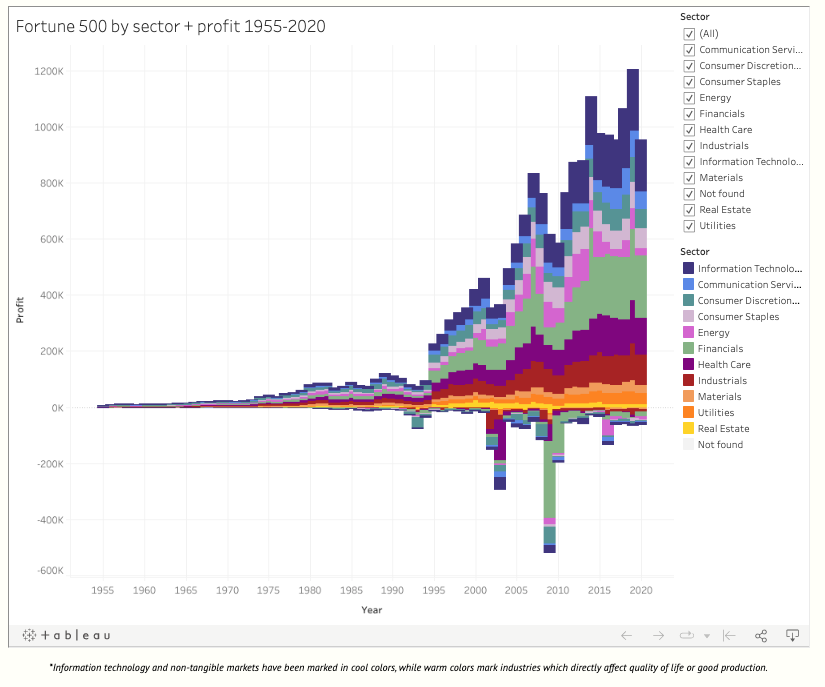
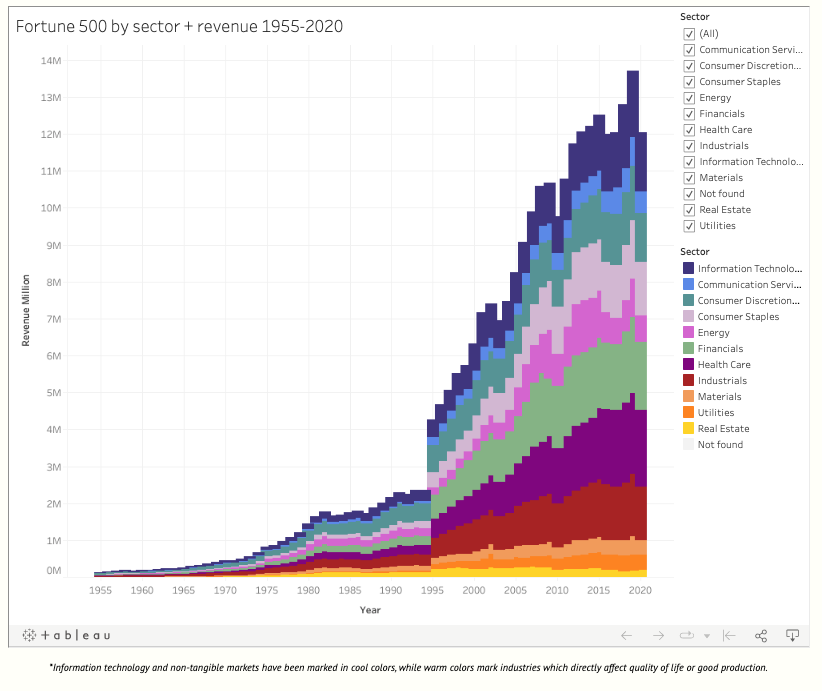
The Fortune 500 means of measurement has shifted over time to include new industries, but has kept an archive of their 500 largest companies from 1955 to present day available publicly.† In 2020, the list of Fortune 500 companies made up 2/3s of the entire economy alone.† So how do we find patterns in this data? In a publicly available data effort, we’ve mapped the companies in the Fortune 500 archived to relevant sectors † and industries to explore the shift of market players over the past 65 years.


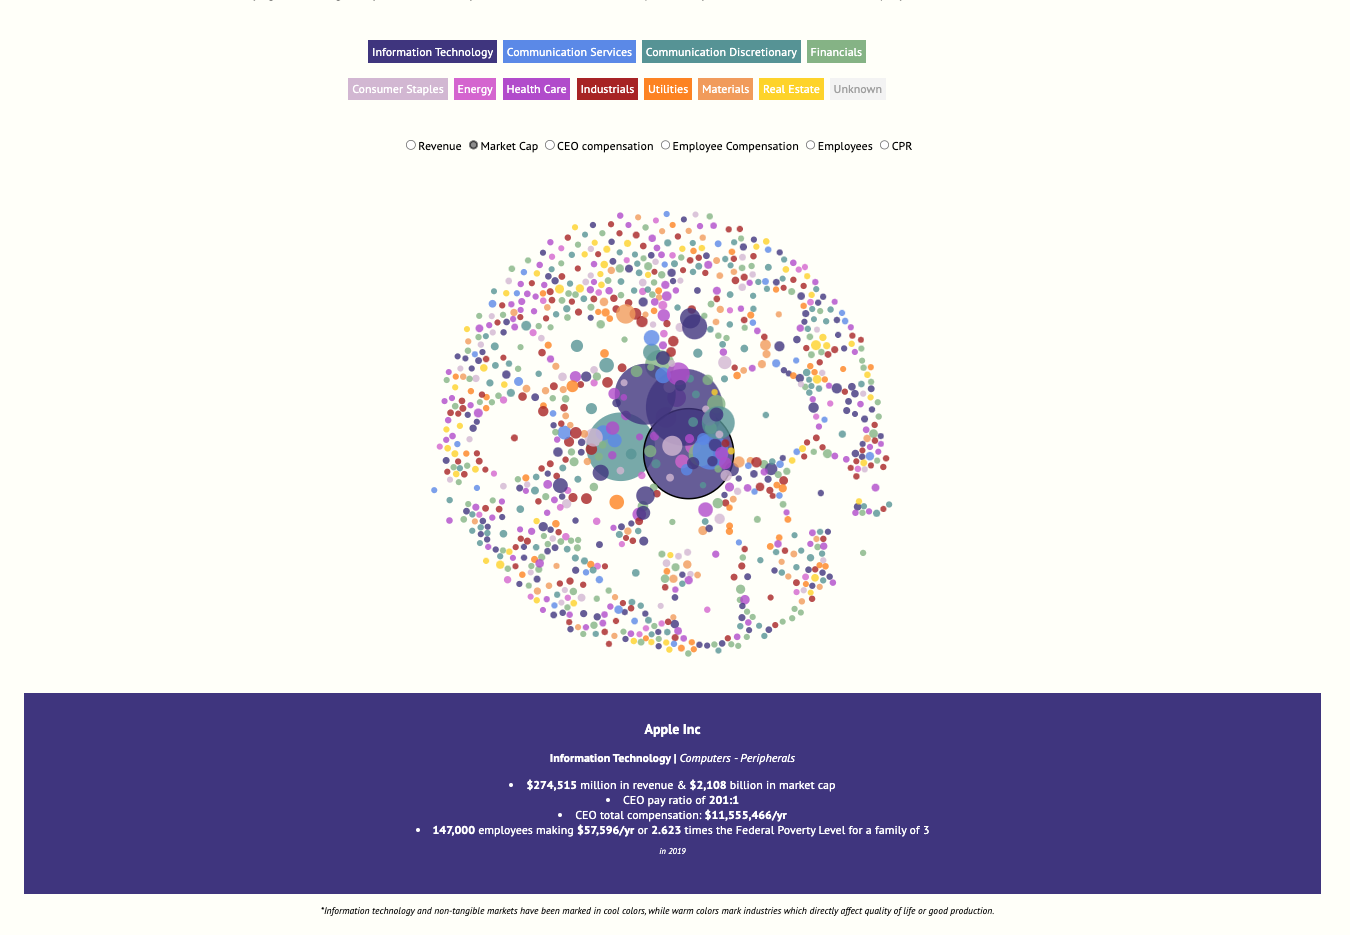
As the stock market and revenues have soared in recent decades, researchers have been looking for new ways to identify and explore contributing factors in the subsequent wealth inequality in America†.New ways of measuring dominance in a market have emerged in recent decades including an increased priority in examining market cap, employee compensation, CEO compensation (including salaries and other assets), and CEO pay ratio (required after regulatory efforts post Dodd-Frank rulings).
